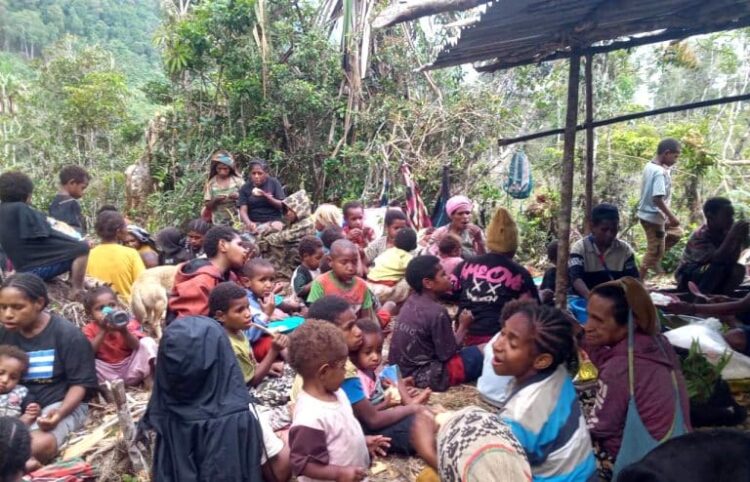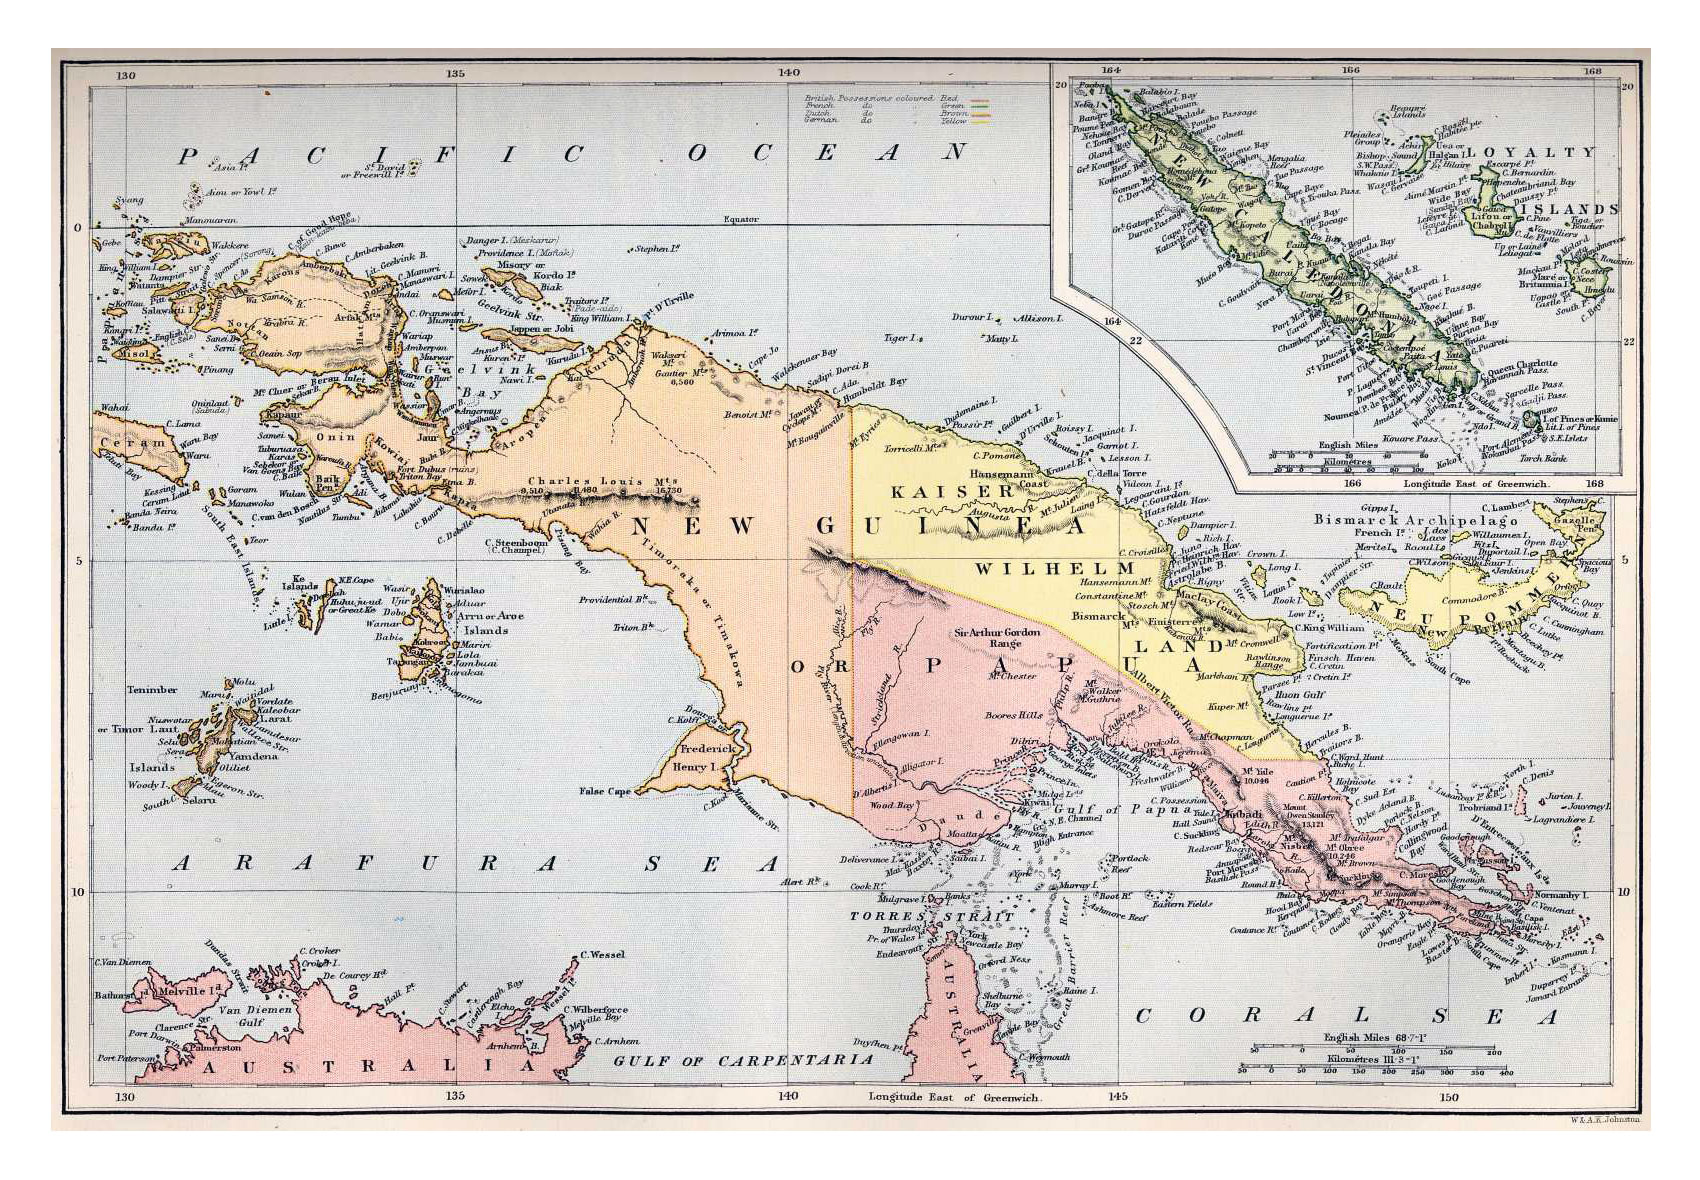

The term “Melanesia” etymologically means the “black islands,” representing one of the most crucial geostrategic and geoeconomic zones in the Pacific belt. You will find that Melanesian countries not only host an epicenter of global biodiversity and mineral reserves, but they also stage a fierce geopolitical rivalry among world powers. Nations located in this area—such as Papua New Guinea (PNG), the Solomon Islands, Vanuatu, and Fiji, along with culturally affiliated nations like Timor-Leste—face similar existential challenges. They battle vulnerability to global supply chain shocks, climate change threats, and the difficult transition from subsistence economies to modern institutions. New Caledonia, operating as a sui generis entity under French administration, adds regional complexity through its decolonization dynamics and commodity-based economic crises.
On the other hand, the Republic of Indonesia holds a unique and central position. As the world’s largest archipelagic state and a G20 economic powerhouse, Indonesia shares a direct land border with this region through the island of New Guinea. Administratively and culturally, the country also governs millions of people of Melanesian descent spread across nine provincial-level territories. This comparative analysis presents a deep, expert-scale evaluation of the geographical dimensions, political architecture, macroeconomic profiles (focusing on 2025 projections and actual data), and socio-demographic indicators. Our reporting methodology integrates empirical data to untangle the paradox between massive natural wealth and the structural vulnerabilities experienced by entities in these Melanesian countries and regions.
1. Geographical Configuration and Spatial Ecology
Melanesia’s geographical characteristics feature extreme topography. You will see steep volcanic mountains, dense ancient rainforests, and coral archipelagos scattered across the vast Pacific Ocean. This spatial condition dictates settlement patterns, logistics costs, and the state’s ability to penetrate civil services into the hinterlands and outer islands.
1.1 Geography of Sovereign States and Independent Territories
Experts classify most Melanesian countries as Small Island Developing States (SIDS), except for Papua New Guinea, which possesses a vast continental landmass. This fragmented geography creates natural isolation that protects linguistic diversity but simultaneously hinders domestic market integration.
| Country / Territory | Geographical Location | Total Area (km²) | Official Language(s) | Capital City |
| Papua New Guinea | Oceania, eastern New Guinea island | 462,840 | English, Tok Pisin, Hiri Motu | Port Moresby |
| Solomon Islands | Oceania, archipelagos east of PNG | 28,896 | English | Honiara |
| Vanuatu | Oceania, South Pacific | 12,189 | Bislama, English, French | Port Vila |
| Fiji | Oceania, South Pacific | 18,274 | English, Fijian, Fiji Hindi | Suva |
| Timor-Leste | Southeast Asia, eastern Timor island | 15,007 | Tetum, Portuguese | Dili |
| New Caledonia | Oceania, South Pacific | 18,576 | French | Nouméa |
Geographical isolation experienced by the Solomon Islands and Vanuatu, for instance, makes maritime and air transport vital lifelines that remain highly vulnerable to natural disruptions like tropical cyclones. Timor-Leste, although geographically located in Southeast Asia, shares topographical, historical, and demographic affinities that often place it within the Melanesian discourse, as it shares the same ecological island with Indonesia’s Nusa Tenggara region.
1.2 Geography of the Republic of Indonesia and Provinces with Melanesian Populations
On a macro level, the Republic of Indonesia occupies 1,904,569 km² stretching across the equator, making it a strategic bridge between the Indian and Pacific Oceans. The official language is Indonesian, and the national capital is currently transitioning to Nusantara on the island of Borneo. However, to analyze the Melanesian regional penetration within Indonesia’s sovereign borders, we must direct our geographical focus to eastern Indonesia.
The Indonesian government recently executed a massive administrative restructuring on the island of New Guinea to address overly broad geographical spans of control. The government divided the region into six provinces. The following table summarizes the geographical landscape of the nine provinces that serve as population centers for Melanesian people in Indonesia.
| Province | Sub-Regional Geographic Location | Total Area (km²) | Administrative Language | Provincial Capital |
| East Nusa Tenggara (NTT) | Lesser Sunda Islands | 46,378 | Indonesian | Kupang |
| Maluku | Southern Maluku Islands | 46,133 | Indonesian | Ambon |
| North Maluku | Northern Maluku Islands | 31,982 | Indonesian | Sofifi |
| Papua | Northern coast of New Guinea | 81,049 | Indonesian | Jayapura |
| West Papua | Eastern Doberai Peninsula | 64,134 | Indonesian | Manokwari |
| South Papua | Southern Papuan lowlands | 117,833 | Indonesian | Merauke |
| Central Papua | Central-western coast and highlands | 61,079 | Indonesian | Nabire |
| Highland Papua | Inland central mountain valleys | 108,476 | Indonesian | Jayawijaya (Wamena) |
| Southwest Papua | Western Doberai Peninsula & islands | 39,167 | Indonesian | Sorong |
The geographical characteristics of these provinces vary from small volcanic island chains in North Maluku to vast flat swamps and savannas in South Papua. Highland Papua (Papua Pegunungan) holds special geographical significance because it remains the only landlocked province in Indonesia. This status directly causes exponential logistics costs due to absolute dependence on pioneer cargo air transport.
2. Political Landscape, Colonial History, and Institutional Governance
Melanesia’s political architecture directly results from 19th and 20th-century colonial competition, which produced a diverse array of governance systems. The trajectory toward independence for most of these Melanesian countries took place in the second half of the 20th century. This history left a legacy of governance institutions that frequently clash with traditional leadership systems (the Big Man or Chief systems).
2.1 Political Dynamics of Pacific States and Territories
| Country / Territory | State/Government Form | Historical Colonial Power | Independence Year | Head of State & Government |
| Papua New Guinea | Constitutional Monarchy (Westminster) | Germany, Britain, Australia | 1975 | Monarch (Gov. General) / Prime Minister |
| Solomon Islands | Constitutional Monarchy (Westminster) | Britain | 1978 | Monarch (Gov. General) / Prime Minister |
| Vanuatu | Parliamentary Republic | Britain & France (Condominium) | 1980 | President / Prime Minister |
| Fiji | Parliamentary Republic | Britain | 1970 | President / Prime Minister |
| Timor-Leste | Semi-Presidential Republic | Portugal and secede from Indonesia | 2002 | President / Prime Minister |
| New Caledonia | Sui Generis Collectivity (French Territory) | France | Not Independent | French President / Local Govt President |
A strong subregional alliance called the Melanesian Spearhead Group (MSG) binds this region. Established in 1988 in Port Vila, Vanuatu, the MSG functions as a platform to promote economic cooperation, political solidarity, and intra-Melanesia free trade negotiations. Full members of this group include Fiji, Papua New Guinea, the Solomon Islands, Vanuatu, and the Front de Libération Nationale Kanak et Socialiste (FLNKS), a political party coalition fighting for New Caledonia’s independence. The Republic of Indonesia entered this political dynamic as an Associate Member in 2015, representing millions of ethnic Melanesians within its sovereign territory. However, diplomatic maneuvers from the United Liberation Movement for West Papua (ULMWP), which holds observer status, simultaneously color this presence.
Subregional political dynamics in 2024-2026 also featured points of structural crisis. In New Caledonia, a constitutional amendment proposal regarding voting rights triggered the worst civil unrest in decades during mid-2024. This crisis temporarily halted negotiations regarding its autonomous status from France. Meanwhile, Bougainville Island actively prepares a political roadmap toward independence from Papua New Guinea, targeting realization in 2027. This move follows the 2019 referendum results where the absolute majority voted for independence.
2.2 The Republic of Indonesia’s Political System and Asymmetric Autonomy
The Republic of Indonesia operates under a presidential government system within a unitary state framework. The Dutch dominated its colonial history (ending de facto at the independence proclamation on August 17, 1945, and internationally recognized in 1949), interspersed with brief British, French, and Japanese occupations. A President holds the positions of head of state and head of government.
To manage diversity and mitigate separatism, Indonesia implements an asymmetric political decentralization system. The government applies two different legal approaches to the nine provinces with dominant Melanesian populations. The standard regional autonomy framework governs East Nusa Tenggara, Maluku, and North Maluku provinces. Conversely, the Special Autonomy Law specifically regulates the six provinces on the island of New Guinea. This system allocates massive fiscal balancing funds from the central government and creates unique institutions like the Papuan People’s Assembly (MRP). The MRP functions to protect cultural rights, customary representation, and the empowerment of indigenous Papuan women, although critics frequently evaluate its implementation regarding bureaucratic effectiveness.
3. Economic, Monetary, and Macroeconomic Architecture in 2025
The Melanesian economy presents an extreme spectrum. It stretches from the Republic of Indonesia, which boasts a trillion-dollar Gross Domestic Product (GDP), to micro-island economies that heavily rely on Official Development Assistance (ODA) and migrant worker remittances.
3.1 GDP Valuation, Real GDP, and Purchasing Power Parity (PPP)
Based on 2025-2026 projected data from the International Monetary Fund (IMF) and the World Bank, the economic volume of these Melanesian countries and territories shows highly skewed diversification.
| Country / Territory | Currency | Nominal GDP (Billion USD) | Real GDP Growth (%) | Nominal GDP Per Capita (USD) | GDP PPP Per Capita (USD) |
| Indonesia (Total) | Rupiah (IDR) | 1,539.87 | 4.95% | 5,362 | ~16,000 |
| Papua New Guinea | Kina (PGK) | 34.40 | 3.75% | 2,632 | 3,990 |
| New Caledonia | CFP Franc (XPF) | 8.55 | -13.50% (2024)* | 29,213 | Unclassified |
| Fiji | Fiji Dollar (FJD) | 6.35 | ~3.00% | 6,802 | 17,209 |
| Timor-Leste | US Dollar (USD) | 2.05 | 3.90% | 1,399 | 5,270 |
| Solomon Islands | Solomon Is. Dollar (SBD) | 1.84 | 2.50% | 2,086 | 2,787 |
| Vanuatu | Vatu (VUV) | 1.51 | 3.40% | 4,082 | 4,525 |
Real growth highlights specific vulnerability patterns. New Caledonia’s GDP suffered a destructive contraction of -13.50% in 2024 and showed no recovery in 2025. This downturn acts as a direct consequence of political unrest and the collapse of the crucial nickel mining sector. Fiji’s economy slowed toward its historical trend rate of around 3.00% after experiencing a post-pandemic rebound surge from the tourism sector. The Solomon Islands experienced stagnation around 2.50% after foreign investors withdrew large-scale projects and infrastructure stimulus sentiments ended.
Structure of Indonesia’s Subnational Gross Regional Domestic Product (GRDP)
When dissecting the nine provinces in eastern Indonesia, you will see very sharp GRDP disparities based on the presence of the extractive sector.
- Central Papua: This province acts as the largest contributor engine, with its GRDP reaching Rp 174.94 trillion nominally in 2024. The GRDP per capita in this province broke through the equivalent range of USD 7,493. However, copper and gold extraction at the Grasberg mine almost entirely dictates this real growth. If you remove the mining sector from the equation, real growth drops drastically, proving structural inequality.
- North Maluku: This region recorded the highest double-digit GRDP percentage growth over the past five years thanks to nickel downstreaming (smelters). Yet, this added value often concentrates in capital-intensive sectors and does not necessarily flow proportionally to grassroots community welfare.
- Non-Extractive Provinces (East Nusa Tenggara, Maluku, Highland Papua): Household consumption, subsistence fisheries, and government administration drive the economies of these provinces. Highland Papua recorded the lowest regional GRDP because it lacks land logistics access to international seaports, paralyzing its industrialization capability.
3.2 Inflation Indicators (5-Year Trend), CPI, and Producer Price Index (PPI)
Exogenous shocks—the pandemic, maritime logistics interruptions, global energy price spikes, and fiscal policy changes—drove inflation trends between 2020 and 2025 across the Melanesian region. Entering 2025, disinflationary pressures began to operate regionally.
Over the last five years, Fiji experienced inflation braking from its peak in 2023 due to Value Added Tax (VAT) adjustments. Experts project it to stabilize around 3.6% in 2025, alongside a Consumer Price Index (CPI) decline in the utility sector. Papua New Guinea (PNG) experienced severe inflation volatility during the same period due to domestic food commodity fluctuations (especially the price instability of subsistence products like betel nut) and global supply chain disruptions. However, it began to moderate at 3.6% year-on-year by mid-2025. Timor-Leste briefly entered a technical deflationary phase before its CPI crept up to an average of 0.9% in 2025 as the baseline of cheap imported rice faded.
In eastern Indonesia, the main problem isn’t just aggregate numbers, but geography-based price disparities. Government initiatives like the “Sea Toll” (maritime highway) suppressed maritime inflation. However, in areas unreachable by sea, inflation remains disproportionate. In November 2025, Highland Papua reported y-o-y inflation of 4.05% with a high CPI level of 113.61, relying heavily on the Household Consumption Index. The Producer Price Index (PPI) across the region remains highly elastic. In North Maluku and Central Papua, the PPI submits to London Metal Exchange fluctuations, while in Vanuatu and Samoa, the PPI responds to the cost of imported raw materials supporting tourism.
3.3 Labor Market: Unemployment Rate and Labor Force Participation
Labor statistics in the Pacific islands manifest the ambiguity of the informal economy. High Labor Force Participation Rates (LFPR) numerically often do not represent formal decent work, but rather uncompensated family farming.
The Solomon Islands leads with an LFPR reaching 84.3% (2025). Other Melanesian countries like PNG show a similar trend where the workforce concentrates in rural subsistence zones. Diametrically, structural Open Unemployment Rates actually plague regions attempting to shift to manufacturing or services. Fiji, after suffering massive pandemic-era unemployment, successfully suppressed its unemployment rate to 4-5% in 2025 as tourist resorts normalized. Conversely, the collapse of the real sector in New Caledonia hoisted its unemployment estimates to above 7.5% in late 2024 leading into 2025.
Within Indonesia, Papua Province’s LFPR reached 63.98% with unemployment at a controlled level of 6.96% in 2025. The fisheries and government services sectors primarily absorbed these workers. Highland Papua presents a statistical anomaly with an extraordinary LFPR of 90.66%. This indicates that almost the entire working-age population must descend into sweet potato farming to survive. North Maluku and Maluku provinces reported unemployment rates of approximately 4.44% and 6.11%, respectively.
The Role of the PALM Scheme and Remittances
For sovereign island nations suffering from a lack of internal job creation, labor exports provide a macroeconomic survival mechanism. The Pacific Australia Labour Mobility (PALM) program and New Zealand initiatives absorbed tens of thousands of seasonal workers. In 2025, records show departures of over 6,400 workers from Vanuatu and 5,305 workers from Fiji, along with thousands from Timor-Leste and the Solomon Islands. The remittances these groups send home equal a significant portion of the national GDP, cushioning unemployment pressures, and serving as the most reliable current account safety valve for the Pacific islands.
3.4 External Balance: Balance of Payments, Trade, and Foreign Exchange Reserves
The narrow domestic manufacturing production base causes chronic trade deficits for most Pacific nations. Fiji, Vanuatu, and the Solomon Islands must import fossil fuels, machinery, and most functional food supplies. In 2024-2025, Vanuatu’s current account faced severe pressure, with the deficit widening to -7.6% of GDP. This acted as a direct impact of the Air Vanuatu airline liquidation, which froze dollar inflows from tourism. Fiji experienced an estimated current account deficit of -6.7% in 2024, even though its service exports remained resilient. The Solomon Islands and Timor-Leste also suffered massive absolute trade deficits.
Indonesia, conversely, acts as a net commodity exporter, printing trade surpluses, although its current account deficit fluctuates. Papua New Guinea also consistently maintains a strong goods trade surplus through Liquefied Natural Gas (LNG), copper, and timber exports, sustaining its tax revenues.
Meanwhile, the foreign exchange reserves architecture varies. Fiji’s foreign exchange reserves provide enough to finance about four to five months of imports in 2025. Timor-Leste holds the most unique foreign exchange balance position in the region. Its sovereign wealth fund (Petroleum Fund) accumulated liquidity up to over 939% of its non-oil GDP in 2024, functioning as an external defense fortress against depleting active oil and gas production.
3.5 Foreign Debt Architecture and Debt-to-GDP Ratio
The vulnerability of foreign currency-denominated debt profiles limits the fiscal maneuvering room in the Melanesian region. Public debt burden analysis reveals the following conditions:
- Fiji: This economy bears the highest public debt ratio burden, hovering around 79.4% to 80% of GDP in 2024-2025. Although tax revenues started to recover, the maneuvering room for new fiscal injections remains very narrow.
- Vanuatu: A series of external shocks (twin cyclones in 2023) forced this country to increase multilateral borrowing. This pushed the debt ratio to around 43.4% of GDP at the end of 2024, where external debt obligations to global institutional creditors dominate about 70% of it.
- Solomon Islands: Although traditionally maintaining a low ratio, infrastructure stimulus and public spending raised debt to 20.2% – 22.3% of GDP in 2024-2025. This triggered warnings about medium-term sustainability risks.
- Papua New Guinea: Its fiscal consolidation program, aided by budget adjustments, successfully pushed its peak debt down to about 52% of GDP in 2024-2025.
3.6 Genuine Progress Indicator (GPI), Economic Drivers, and Average Income
Conventional GDP metrics often obscure the reality of welfare because they fail to discount environmental damage and natural capital depreciation. The Genuine Progress Indicator (GPI) concept holds high relevance for evaluation in the Melanesian region.
The extractive mining and forestry sectors primarily drive the economies in Indonesia’s eastern provinces (Papua, North Maluku) and Papua New Guinea. However, the deforestation rate for mineral exploitation permits, oil palm monocultures, or commercial logging drains ecosystem functions. The GPI drastically adjusts GDP growth figures downward when accounting for nickel mining waste in New Caledonia and North Maluku, which damages productive community fisheries’ coral reefs. In the Solomon Islands, the forest depletion (logging) rate indicates that short-term economic growth actually sacrifices the productive capacity of future generations. In Fiji and Vanuatu, the tourism sector acts as the main driver. Tourism possesses a higher sustainability value in GPI terms, but it remains highly fragile to carbon disruptions (e.g., climate change destroying coastal infrastructure).
Average daily worker incomes show significant differences. Outside the formal corporate sector, freelance day laborers dominate. As a comparison, in mid-2025, daily wages for artisans in Maluku ranged around Rp 145,000, in Papua Rp 150,000, and in North Maluku reached a peak of Rp 160,000, driven by the influx of manufacturing capital. However, high subsistence inflation and regional transportation costs erode this purchasing power. The average household income in rural PNG, the Solomon Islands, and the inland Papuan highlands does not transact with monetary mediums, but relies on traditional barter.
4. Demographic Analysis, Public Welfare, and Development Indices
Melanesia’s demographic structure features a stark inequality between massively expanding urban areas (port and administrative centers) and still-isolated hinterlands. This inequality presents a systemic obstacle in developing human capital.
4.1 Population Size, Population Density, and Distribution Inequality
Cumulatively, Indonesia contributes the largest national demographic mass with a national population of over 280 million people. However, if we narrow this down to the subnational Melanesian region: the main Papua Province (post-division) hosted about 1.06 to 1.08 million people in 2024-2025.
Papua New Guinea ranks as the sovereign state with the largest population among Melanesian countries (estimated to exceed 10 million residents, though debates exist over census accuracy in the hinterlands). Island nations in the South Pacific house micro-populations: Timor-Leste has about 1.3 million people, Fiji approaches 1 million people, the Solomon Islands holds an estimated 798,079 people (2025), while Vanuatu and New Caledonia hover around 300,000 and 270,000 residents, respectively.
Population Density in Melanesia falls among the lowest density regions in the world. This fundamentally creates extremely challenging economies of scale for infrastructure provision. Papua Province, for example, recorded a density of only 13.14 to 14.33 people per km². This distribution is extremely polarized; the capital Jayapura City is densely packed at 503.40 people per km², contrasting sharply with Mamberamo Raya Regency, which has a sparse density of less than 1.40 people per km². Identical patterns occur in PNG (Port Moresby versus steep mountainous regions) and the Solomon Islands.
4.2 Life Expectancy and Infant Mortality Rate
Public health system indicators reveal the extent to which a state can intervene in the biological welfare of its citizens. New Caledonia achieved the highest Life Expectancy at 79.2 years. This positive anomaly became possible due to the assimilation of universal healthcare subsidies directly from the French metropolitan government.
In contrast, fiscally independent sovereign states struggle with limited resources. Vanuatu recorded a Life Expectancy of around 72.0 years, while the Solomon Islands hovered around 71 years. Malnutrition, limited access to clean water, and a shortage of medical personnel in remote archipelago areas simultaneously maintain the Infant Mortality Rate at critical levels in remote areas of PNG and the Solomons.
Within Indonesia’s jurisdiction, the inequality in medical services between the center and the periphery looks very striking. Although nationally Indonesia projected a Life Expectancy of 74.77 years in 2025, this number drops significantly when filtered for the eastern region. The main Papua Province has a Life Expectancy of 70.77 years, and Central Papua stood at an estimated 68.38 years in 2025. Geographic distance from referral-level hospital facilities, a scarcity of specialist doctors in newly formed regions, high malaria endemicity, and maternal nutrition challenges precipitate the low survival probabilities in these areas.
4.3 Literacy Rate and Human Development Index (HDI)
The Human Development Index (HDI), an aggregate score of long and healthy life dimensions, knowledge (Expected Years of Schooling), and a decent standard of living, maps human resource quality vividly. In 2025, Statistics Indonesia released a report stating that Indonesia’s national HDI broke into the “High” category with a score of 75.90. However, the chasm at the subnational level fragments this achievement. Among the Melanesian-populated regions in Indonesia, the disparity appears very real:
- High Category: Papua (74.69)—boosted by Jayapura City’s score, Maluku (74.09), North Maluku (72.52), and Southwest Papua (70.55).
- Medium Category: East Nusa Tenggara (69.89), South Papua (69.54), and West Papua (68.48).
- Lower Transition Category: Central Papua recorded an HDI of 60.64, while Highland Papua lagged at a level of 54.91. This makes it the province with the lowest human development score in the entire Republic of Indonesia.
Internationally, stalled convergence in HDI is very apparent in the Solomon Islands and PNG. Authorities often report the Literacy Rate for urban residents over 15 years old reaching more than 95% (such as in Papua Province, which reached 98.39%). However, functional data in rural areas shows that a large proportion of the workforce only holds a basic education. Thus, they cannot absorb into extractive industries that require intermediate technical literacy.
4.4 Social Progress Index (SPI) and Gross National Happiness (GNH)
The shift in discourse from extractive capitalism gives rise to holistic welfare metrics like the Social Progress Index (SPI) and Gross National Happiness (GNH). In the latest World Happiness Report survey, analysts find it very difficult to directly compare the average happiness index scores in this region with developed countries. Several countries lack complete datasets due to the absence of infrastructure for in-depth, periodic psychosocial censuses.
Furthermore, applying GNH has a different structural resonance for Melanesian societies. In this region, people lay the foundations of happiness and material security on organic kinship systems (the wantok system in PNG and the Pacific, the pela gandong tradition in Maluku). These systems rely heavily on customary communal land ownership laws. Land serves not merely as a fiscal asset, but as an existential identity.
When GDP spikes due to the influx of mining concessions or commercial logging, the resulting damage often eliminates citizens’ access to ancestral lands. The loss of this cultural living space erodes social resilience, deepens the alienation of the younger generation, and tangibly dashes the Social Progress Index, even if export indicators on paper show a double surplus.